
23 March 2026
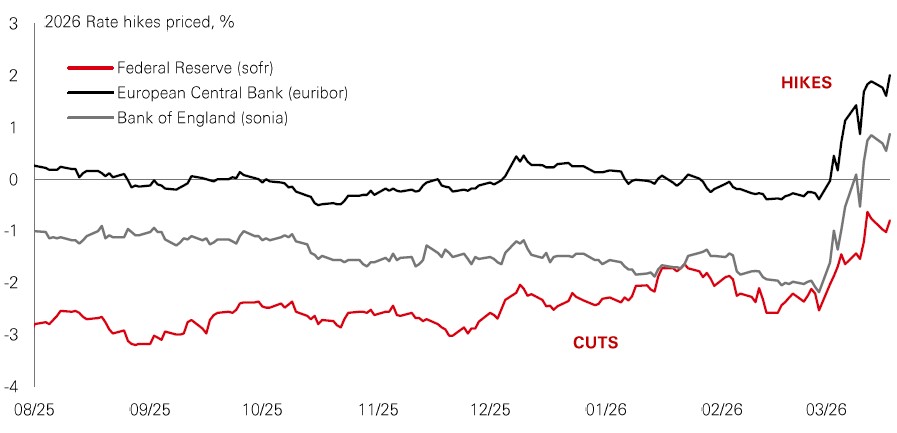
In the wake of the recent oil shock, markets have priced in a more hawkish path for interest rates. This is a logical reaction, as higher commodity prices directly boost CPI inflation. The 2022 oil price spike and subsequent surge in policy rates demonstrated just how significant a monetary policy response can be, accounting for a large portion of the market damage that year.
But is 2022 the right playbook for today? For inflation to remain persistent, an initial shock must be transmitted through the broader macro system. Today, this might be less of a threat than a few years ago. Western GDP growth rates are notably weaker than they were back then, US growth is unbalanced, labour markets are fragile, and monetary policy is neutral-to-mildly restrictive. Furthermore, amid strained public finances, there will likely be only a tepid fiscal response to support households through this crisis. We are operating in an environment where the so-called “second-round” effects of the initial shock – driven by higher wage demand and increased corporate pricing – are likely to be limited.
After several years of overshooting inflation targets, some central banks may still feel the need to tighten policy. However, given the oil shock also implies downside growth risks, major central banks opted to talk-the-talk with “hawkish holds” rather than walk-the-walk and hike. This approach helps prevent inflation expectations from unanchoring, effectively buying policymakers time. It also suggests that once the current crisis subsides, the easing cycle can continue. That would probably result in a very different market outcome to 2022 – one where the volatility episode is transitory and the stock-bond correlation stays closer to zero.
Geopolitical events and spiking commodity prices have upended 2026’s big market theme of “broadening out”. European stocks, for example, have gone from being outperformers to underperformers. But emerging markets are proving resilient. In today’s risk-off situation, the dollar has been strengthening at a similar pace to that seen in Q1 2022. Capital flight back to the dollar usually means EM outflows, weaker currencies, and worsening EM debt burdens.
But there are clear signs of EM resilience. First, not all EM currencies are down. The Colombian peso is up in March. And currencies in Brazil, China, and Mexico have all outperformed the dollar year-to-date. Second, EM assets haven’t tracked the dollar’s move down. Investors have been de-risking from popular trades, but price action also implies a recognition that EM fundamentals have improved. And third, once we account for the safety characteristics of US Treasuries in this episode, EM bonds still have lower volatility than global ex US government bonds.
The broadening-out trade has been interrupted, but EMs are still looking resilient – if you know where to look.
The value of investments and any income from them can go down as well as up and investors may not get back the amount originally invested. Past performance does not predict future returns. The level of yield is not guaranteed and may rise or fall in the future. Past performance does not predict future returns. For informational purposes only and should not be construed as a recommendation to invest in the specific country, product, strategy, sector, or security. Diversification does not ensure a profit or protect against loss. Any views expressed were held at the time of preparation and are subject to change without notice. Any forecast, projection or target where provided is indicative only and is not guaranteed in any way. Source: HSBC Asset Management, Bloomberg, Macrobond. Data as at 7.30am UK time 20 March 2026.
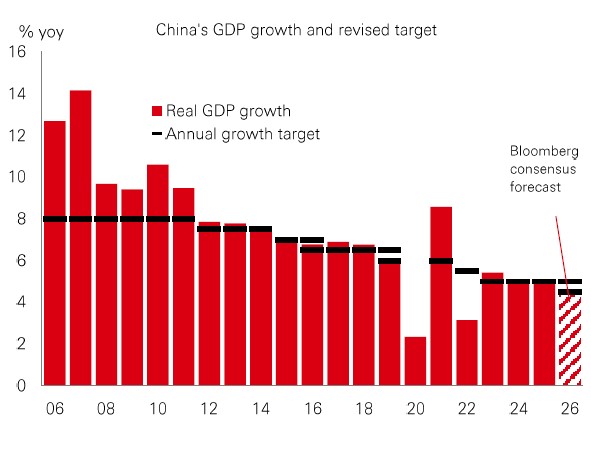
China’s stock market has been remarkably resilient in the face of rising geopolitical risks. Despite being a major energy importer – and vulnerable to commodity price shocks – China’s strategic reserves, diversified sourcing and import routes, and expanded energy mix, are providing energy resilience. No surprise then that its new Five-Year Plan (FYP) prioritises energy security, the green transition, and energy infrastructure. Policymakers ratified the FYP at the recent “Two Sessions” meetings and set a new 2026 real GDP growth target of 4.5-5.0% (from “around 5%” last year). That change is a nod to the competing demand of supporting stable economic expansion while minimising bottlenecks and risks. |
The new FYP marks a shift in policy focus from rapid growth to quality growth, economic resilience, and national security. Apart from energy, that means boosting domestic consumption, accelerating tech and innovation to drive productivity, and an emphasis on self-reliance – with AI a key focus. Efforts to build a more unified national market, as well as capital market reforms to attract foreign investors, are also priorities. Overall, China’s market resilience, policy support, tech focus, and relatively low valuations, continue to support a positive view.
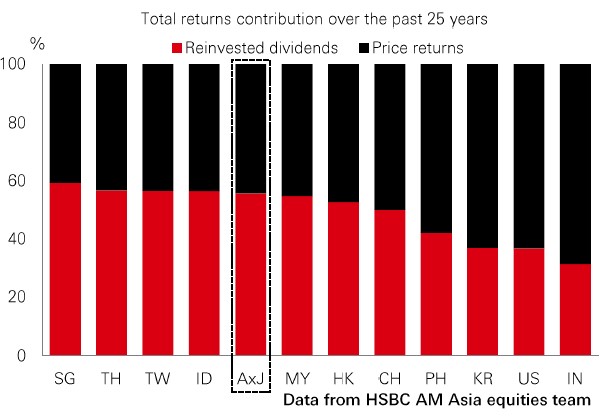
Warren Buffett once observed that the “secret sauce” to solid returns lay in good quality, dividend-paying stocks. Part of the appeal of dividends is their resilience, even in downturns. In today’s uncertain geopolitical climate, this explains why dividend strategies have performed well lately. Dividends are particularly influential in Asia (ex-Japan), where payouts account for more than half of total returns over the past 25 years – compared to more like a third in the US. There are reasons why this could be increasingly appealing to global investors. First, the combination of a stream of dividends, lower relative valuations, and growth upside makes Asia a potentially attractive source of diversification from more expensive, lower-yielding markets. Second, countries like South Korea and China are taking policy action to encourage firms to boost payouts. Third, Asian firms are in increasingly good financial shape when it comes to cash and profits, giving them more flexibility to reward shareholders. |
With policy and geopolitics driving uncertainty, Asia’s dividend track record and increasingly shareholder-friendly outlook should appeal to investors looking for Buffet’s “secret sauce”.
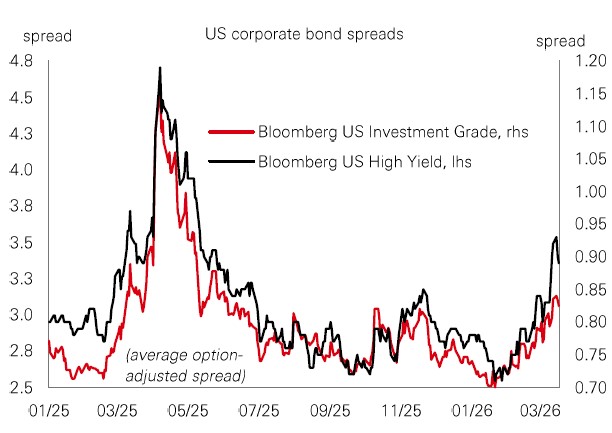
It’s been a tricky year for Western credit markets. US investment grade and high-yield spreads entered 2026 at multi-year tights, leaving them priced for perfection and vulnerable to macro disappointments, as well as geopolitical turmoil that has dominated headlines. Where does this leave investors? Fortunately, corporate earnings remain solid and a hawkish pivot for the Federal Reserve looks unlikely. But the high-yield sector faces challenges, from K-shaped dynamics in the US, to geopolitics, and concerns over private credit and software names. Although spreads have widened this year, investors may not be compensated for the exposure to these risks. Caution remains the watchword. |
The story for IG is a bit different. Year-to-date spread widening has been relatively contained, anchored by robust balance sheets, insulating the asset class from macro headwinds. Supply dynamics are worth monitoring: record net new issuance is expected in 2026 amid AI-related spending. Even so, IG’s resilience during recent volatility makes it a logical choice for fortifying portfolios in rocky times.
Past performance does not predict future returns. The level of yield is not guaranteed and may rise or fall in the future. For informational purposes only and should not be construed as a recommendation to invest in the specific country, product, strategy, sector, or security. Diversification does not ensure a profit or protect against loss. Any views expressed were held at the time of preparation and are subject to change without notice. Index returns assume reinvestment of all distributions and do not reflect fees or expenses. You cannot invest directly in an index. Any forecast, projection or target where provided is indicative only and is not guaranteed in any way. Costs may vary with fluctuations in the exchange rate. Source: HSBC Asset Management. Macrobond, Bloomberg. Data as at 7.30am UK time 20 March 2026.


For informational purposes only and should not be construed as a recommendation to invest in the specific country, product, strategy, sector or security. Any views expressed were held at the time of preparation and are subject to change without notice. Any forecast, projection or target where provided is indicative only and is not guaranteed in any way. Source: HSBC Asset Management. Data as at 7.30am UK time 20 March 2026.
Elevated geopolitical uncertainty is weighing on risk markets, with energy prices remaining volatile. The US dollar retreated following recent rallies, while gold prices weakened further. The US Treasury yield curve flattened: short-end yields rallied as Fed rate cut expectations were largely pared back, while long-end yields stabilised after surging over the past two weeks. In equities, emerging markets fared better than developed markets, with commodity-driven markets in Latin America a key driver. EM Asian bourses traded mixed: Chinese equities weakened. Sensex rebounded modestly, and Kospi surged. Across DM, the S&P 500 drifted lower, with losses in Consumer Staples and Materials offsetting gains in Energy, while the small-cap Russell 2000 edged higher. European stocks saw widespread weakness, as Nikkei 225 also declined.


We’re not trying to sell you any products or services, we’re just sharing information. This information isn’t tailored for you. It’s important you consider a range of factors when making investment decisions, and if you need help, speak to a financial adviser.
As with all investments, historical data shouldn’t be taken as an indication of future performance. We can’t be held responsible for any financial decisions you make because of this information. Investing comes with risks, and there’s a chance you might not get back as much as you put in.
This document provides you with information about markets or economic events. We use publicly available information, which we believe is reliable but we haven’t verified the information so we can’t guarantee its accuracy.
This document belongs to HSBC. You shouldn’t copy, store or share any information in it unless you have written permission from us.
We’ll never share this document in a country where it’s illegal.
This document is prepared by, or on behalf of, HSBC UK Bank Plc, which is owned by HSBC Holdings plc. HSBC’s corporate address is 1 Centenary Square, Birmingham BI IHQ United Kingdom. HSBC UK is governed by the laws of England and Wales. We’re authorised by the Prudential Regulation Authority (PRA) and regulated by the Financial Conduct Authority (FCA) and the PRA. Our firm reference number is 765112 and our company registration number is 9928412.


